1. Production and curation of the imagedataset
An ad hoc image repository was created to give visual form to Alfred H. Barr’s diagram and to prepare the material to be analysed by CNN Inception. This image repository consists of digital reproductions of “representative” pieces of the specific art movements, styles and authors included in Barr’s diagram.
Hence, this dataset replicates the same exclusions as in the diagram, which comes from a Western and Eurocentric perspective, widely discussed in critical and academic literature. It also shows the same limitations, as it is restricted to the specific movements, styles and authors included in it. This is perhaps the only concession to the point of view of a contextually and intellectually situated subject.
The search for digital reproductions has been an opportunity to reflect on parallel but no less important matters, such as the issue of the under-representation of certain movements, styles and artists in the digital icon sphere. In the project, an attempt has been made to assess these imbalances by establishing a standard number of 50 works for each specific movement, style and artist appearing in Barr’s chart. In some cases, we had to resort to works that were produced after the dates marked in the chart’s chronology.
Open repositories such as Wikimedia Commons or WikiArt, collectors such as Google Arts and Culture, and museums’ online catalogues have been used to collect data. The source of all the images is specified in the metadata file.
Each image has been described with a reduced set of metadata, which are as follows:
filename (ID)
creator
title
date
movement
image source The metadata files are available here.
2. Analysis with CNN Inception
Once all the information and image files were standardized, the dataset was analysed with a CNN Inception trained with the ImageNet 2012dataset. Afterwards, a dimensionality reduction algorithm, specifically UMAP, was applied in order to project the results of the analysis into a two-dimensional space. Finally, the cluster detection was carried out with HDBSCAN, a refined version of the classic DBSCAN algorithm for unsupervised learning using density measurements.
All materials are accessible on Github with a MIT licence.
3. Possible interpretations and readings
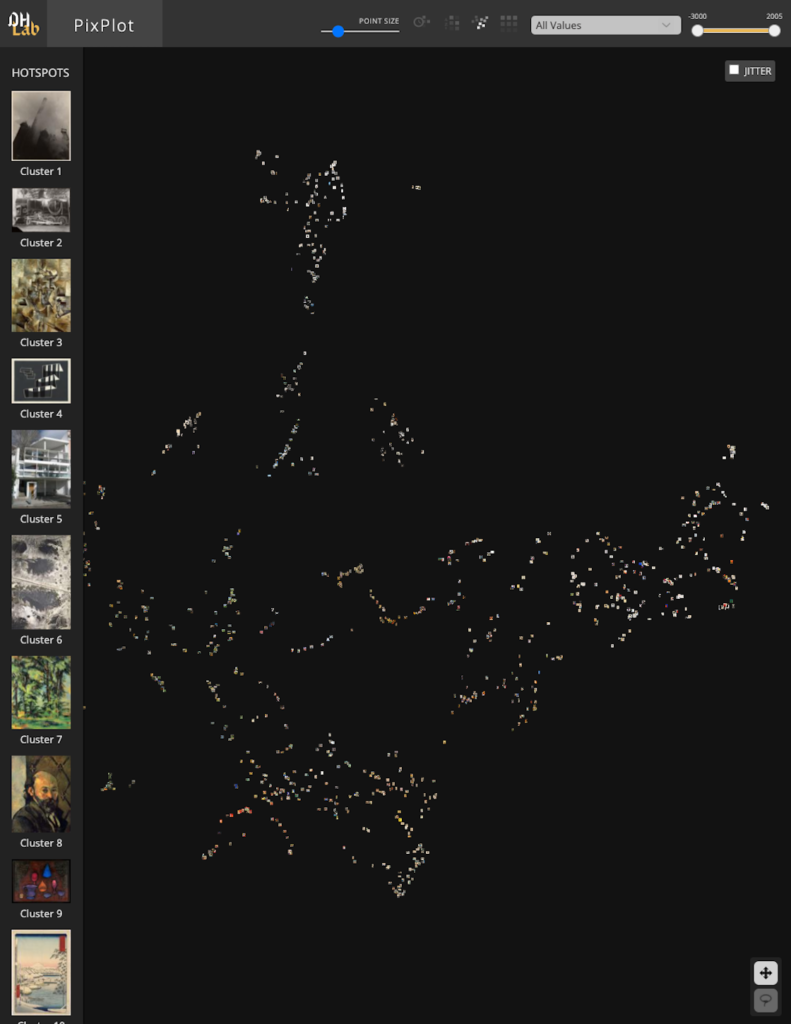
The interpretation was made on the basis of the clustered vector space resulting from the computational analysis.
[Click on image to go to the CNN Inception visual field]